library(ThSQCA)
library(QCA)
Loading required package: admisc
To cite package QCA in publications, please use:
  Dusa, Adrian (2019) QCA with R. A Comprehensive Resource.
Springer International Publishing.In part 2 we ran all four sweeps. Two questions remain for a careful analysis. First, QCA can produce three kinds of solution (complex, parsimonious, and intermediate); which should you use? Second, what if a cell has more than one minimal solution? This post answers both with a second, smaller practice data set.
We simulate 60 business software accounts. Each has a renewal score (RNW) and three evaluations: trust (TRU), price (PRC), and support (SUP), all from 0 to 10. In this simulated world, renewal is high when trust is high and either price or support is high. The three evaluations are strongly correlated, which will leave some combinations of conditions unobserved. That is deliberate, because unobserved combinations are exactly what the three solution types treat differently.
library(ThSQCA)
library(QCA)Loading required package: admisc
To cite package QCA in publications, please use:
Dusa, Adrian (2019) QCA with R. A Comprehensive Resource.
Springer International Publishing.make_demo_data2 <- function(n = 60, seed = 89, rho = 0.85) {
set.seed(seed)
clip <- function(x) pmin(10, pmax(0, round(x)))
L <- rnorm(n)
mk <- function() clip(6 + 2 * (rho * L + sqrt(1 - rho^2) * rnorm(n)))
TRU <- mk(); PRC <- mk(); SUP <- mk()
RNW <- clip(pmin(TRU, pmax(PRC, SUP)) + rnorm(n, 0, 0.7))
data.frame(RNW, TRU, PRC, SUP)
}
demo2 <- make_demo_data2()
head(demo2) RNW TRU PRC SUP
1 3 3 4 4
2 6 8 7 7
3 9 9 9 7
4 5 5 4 6
5 10 10 8 9
6 1 2 4 5With three conditions, each either high or low, there are 2 x 2 x 2 = 8 possible combinations. QCA lists them in a truth table. Let us build one by hand with the QCA package, using renewal of 5 or more as the outcome and 7 or more as “high” for each condition.
bin2 <- data.frame(
  RNW = as.integer(demo2$RNW >= 5),
  TRU = as.integer(demo2$TRU >= 7),
  PRC = as.integer(demo2$PRC >= 7),
  SUP = as.integer(demo2$SUP >= 7)
)

tt2 <- truthTable(bin2, outcome = "RNW", conditions = c("TRU", "PRC", "SUP"),
                  incl.cut = 0.8, n.cut = 1, show.cases = FALSE)
tt2
  OUT: output value
    n: number of cases in configuration
 incl: sufficiency inclusion score
  PRI: proportional reduction in inconsistency

    TRU PRC SUP   OUT    n   incl  PRI
1    0   0   0     0     30  0.433 0.433
2    0   0   1     1     7   0.857 0.857
4    0   1   1     1     3   1.000 1.000
6    1   0   1     1     3   1.000 1.000
7    1   1   0     1     4   1.000 1.000
8    1   1   1     1     13  1.000 1.000
Look at the row numbers on the left. Only 6 of the 8 possible combinations appear (rows 3 and 5 are missing), because the data contain no accounts with, for example, high trust alone, or high price evaluation alone. The combinations that are missing are the logical remainders. The column n is the number of accounts in each combination, incl is how consistently they renew, and OUT is 1 when the combination is consistent enough to count as sufficient.
A bar chart of the counts makes the gaps easy to see. Each bar is one of the 8 possible combinations, in the same order as the truth table rows.
cells <- expand.grid(SUP = 0:1, PRC = 0:1, TRU = 0:1)[, c("TRU", "PRC", "SUP")]
cells$n <- mapply(function(a, b, c) sum(bin2$TRU == a & bin2$PRC == b & bin2$SUP == c),
                  cells$TRU, cells$PRC, cells$SUP)
cells$label <- paste0(ifelse(cells$TRU == 1, "TRU", "~TRU"), "*",
                      ifelse(cells$PRC == 1, "PRC", "~PRC"), "*",
                      ifelse(cells$SUP == 1, "SUP", "~SUP"))

op <- par(mar = c(4.5, 9, 3, 1))
n_rev <- rev(cells$n)
bp <- barplot(n_rev, horiz = TRUE, names.arg = rev(cells$label), las = 1,
              col = "#233A9A", xlim = c(0, max(cells$n) * 1.35),
              xlab = "Number of accounts",
              main = "Accounts per combination")
for (i in seq_along(n_rev)) {
  if (n_rev[i] == 0) {
    text(0, bp[i], "not observed (remainder)", pos = 4, col = "#B45309", cex = 0.9, font = 2)
  } else {
    text(n_rev[i], bp[i], n_rev[i], pos = 4, cex = 0.9)
  }
}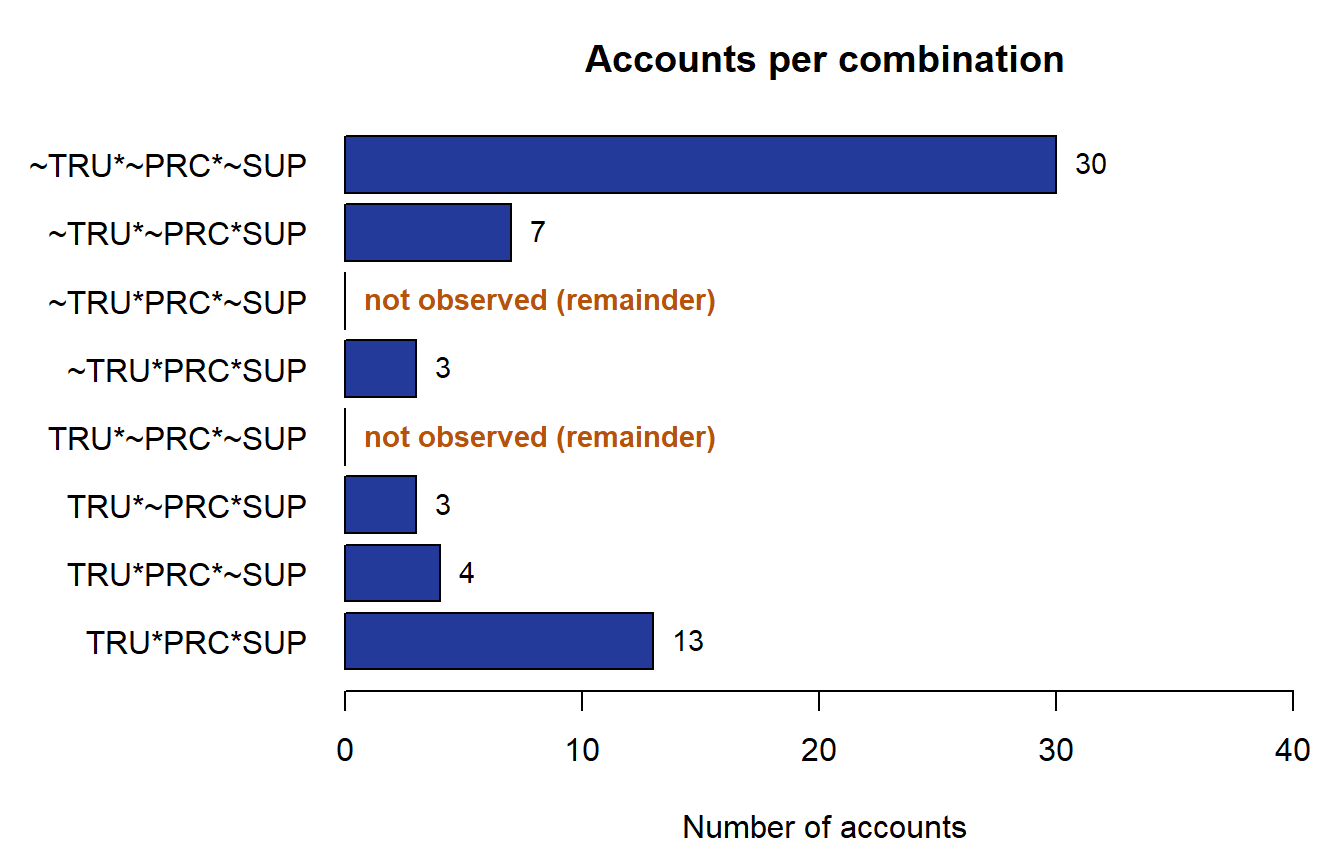
par(op)The two combinations with no accounts are the remainders. Boolean minimization has no cases to check them against, so each solution type has to decide what to do with them.
Remainders matter because Boolean minimization can use them to make a formula shorter, and the three solution types differ in whether, and how, they do that.
| Solution type | Remainders used | include |
dir.exp |
|---|---|---|---|
| Complex | none | "" (default) |
NULL |
| Parsimonious | any remainder that shortens the formula | "?" |
NULL |
| Intermediate | only remainders that agree with your stated expectations | "?" |
e.g. c(1, 1, 1) |
Here dir.exp = c(1, 1, 1) says: we expect high trust, high price evaluation, and high support each to favor renewal.
We run the same outcome threshold sweep (renewal of 5, 6, 7, and 8) three times, changing only the solution type.
thr2  <- c(TRU = 7, PRC = 7, SUP = 7)
cond2 <- c("TRU", "PRC", "SUP")

run2 <- function(...) {
  otSweep(dat = demo2, outcome = "RNW", conditions = cond2, sweep_range = 5:8,
          thrX = thr2, incl.cut = 0.8, n.cut = 1, ...)
}

res_cx <- run2()                                     # complex
res_ps <- run2(include = "?")                        # parsimonious
Warning: Multiple equivalent solutions exist for thrY = 5 (n_solutions > 1).
Only the first solution (M1) and its fit metrics are shown. Use
generate_report() for full analysis.res_im <- run2(include = "?", dir.exp = c(1, 1, 1)) # intermediate
data.frame(
thrY = 5:8,
complex = res_cx$summary$expression,
parsimonious = res_ps$summary$expression,
intermediate = res_im$summary$expression
) thrY complex parsimonious intermediate
1 5 SUP + TRU*PRC TRU + SUP SUP + TRU*PRC
2 6 TRU*PRC + ~PRC*SUP TRU + ~PRC*SUP TRU*PRC + ~PRC*SUP
3 7 TRU*SUP TRU*SUP TRU*SUP
4 8 No solution No solution No solutionThe warning shown with the output is a note from ThSQCA: at renewal of 5, the parsimonious analysis has more than one equally short solution. We come back to this below.
At renewal of 7, all three agree (TRU*SUP), and at 8 none finds a solution. At 5 and 6 the parsimonious solution is shorter. For example, at renewal of 5 it reports TRU + SUP, whereas the complex solution is SUP + TRU*PRC. The term TRU alone covers the combination “high trust, but low price and support evaluations”, which does not appear in the data. The parsimonious solution is willing to assume that this unobserved combination would also be sufficient. The complex solution makes no such assumption. In this particular data set the intermediate solution happens to coincide with the complex one.
How to choose:
| Solution | When it is a good choice | Strength | Caution |
|---|---|---|---|
| Complex | Exploration; you want no assumptions about unobserved cases | Every claim rests on observed cases | Formulas can be long |
| Parsimonious | You want to see the maximal simplification | Shortest formulas | May rely on implausible remainders |
| Intermediate | Theory-driven reporting | Uses only plausible remainders | Needs a justified dir.exp |
Whatever you choose, keep it the same across the whole sweep, and say which one you used.
Boolean minimization can return several equally short solutions for the same truth table. By default ThSQCA reports the first one (M1) and records the number of solutions in n_solutions. To see all of them, use extract_mode = "all".
res_all <- run2(include = "?", extract_mode = "all")Warning: Multiple equivalent solutions exist for thrY = 5 (n_solutions > 1).
Only the first solution (M1) and its fit metrics are shown. Use
generate_report() for full analysis.summary(res_all)OTS Summary
===========
Analysis Parameters:
Outcome: RNW
Conditions: TRU, PRC, SUP
Consistency cutoff: 0.8
Frequency cutoff: 1
Results by Threshold:
thrY expression inclS covS n_solutions
5 M1: TRU + SUP; M2: PRC + SUP 0.967 0.690 2
6 M1: TRU + ~PRC*SUP 0.963 0.788 1
7 M1: TRU*SUP 0.875 0.667 1
8 No solution NA NA 0
Note: 1 threshold setting(s) had multiple solutions.
Use generate_report() for full details.At renewal of 5, the parsimonious analysis finds two minimal solutions of equal length (multiple minimal solutions), TRU + SUP and PRC + SUP. Each of them relies on a different unobserved combination, which is why neither can be preferred on the data alone. ThSQCA prints a note when this happens.
If you prefer a compact view, use extract_mode = "essential". It separates the terms that are present in every solution from the rest.
res_ess <- run2(include = "?", extract_mode = "essential")Warning: Multiple equivalent solutions exist for thrY = 5 (n_solutions > 1).
Only the first solution (M1) and its fit metrics are shown. Use
generate_report() for full analysis.res_ess$summary[, c("thrY", "expression", "selective_terms",
"unique_terms", "n_solutions")] thrY expression selective_terms unique_terms n_solutions
1 5 SUP TRU + PRC M1:TRU; M2:PRC 2
2 6 TRU + ~PRC*SUP <NA> <NA> 1
3 7 TRU*SUP <NA> <NA> 1
4 8 No solution <NA> <NA> 0| Term type | Meaning | Here (renewal of 5) |
|---|---|---|
| Essential | present in every solution | SUP |
| Selective | present in some solutions | TRU and PRC |
| Unique | present in only one solution | TRU in M1, PRC in M2 |
ThSQCA records the alternatives, but deciding which one to prioritize is a theoretical judgment that stays with the researcher.
In part 4, the last part, we turn the results into something you can report: a Markdown report, a configuration chart, and a check against the QCA package.
Software used: R 4.6.1, QCA 3.25.5, and ThSQCA 2.0.9.